Intense
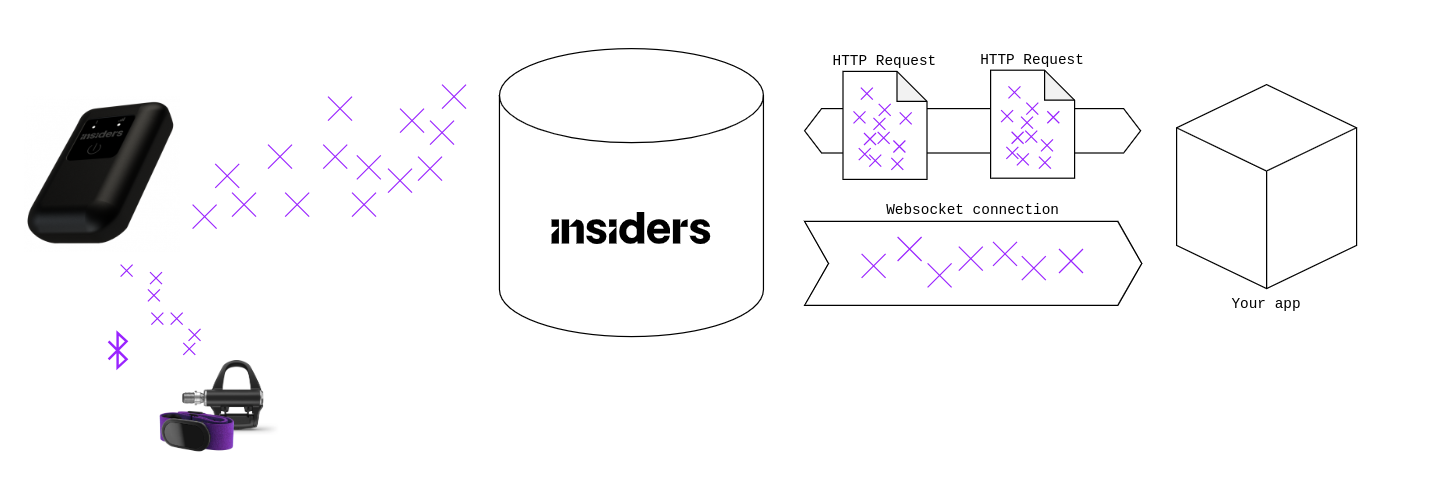
Intense is Insiders' connected tracker and provides live location and performance data, which can be obtained live using the WebSocket API or post-session using the REST API. Optionally, it can also integrate data from a selection of third-party sensors using Bluetooth.
Here is an illustration of the overall data flow for Intense trackers:
For more information about the tracker's characteristics, user manuals, and network coverage, please check out our Help Center. You can also reach out to our support with your questions.
Network drop and chronological order
When processing or visualizing data in real-time, it is important to be aware of network interruptions and how they may affect the ordering of the data points you receive. The stability of the network signal depends mostly on local network coverage. The signal may also be weaker or unavailable underground.
The graph below shows what happens when network connection drops. Every point represents an update from the device, or a data point. Every data point has a timestamp measured when reading the sensor data. Here we compare this time (vertical axis) against the reception time on the API client. In the normal case highlighted in blue, before (1) and after (5), points form a straight line. The angle depend on the latency, and the interval between points should be 1sec.
Every update contains several data points, each of which have their own timestamp ; for simplification we only show the timestamp of the message itself here but the logic remain the same.
This example shows an interruption of both network and GNSS signal. This can happen e.g when going underground.
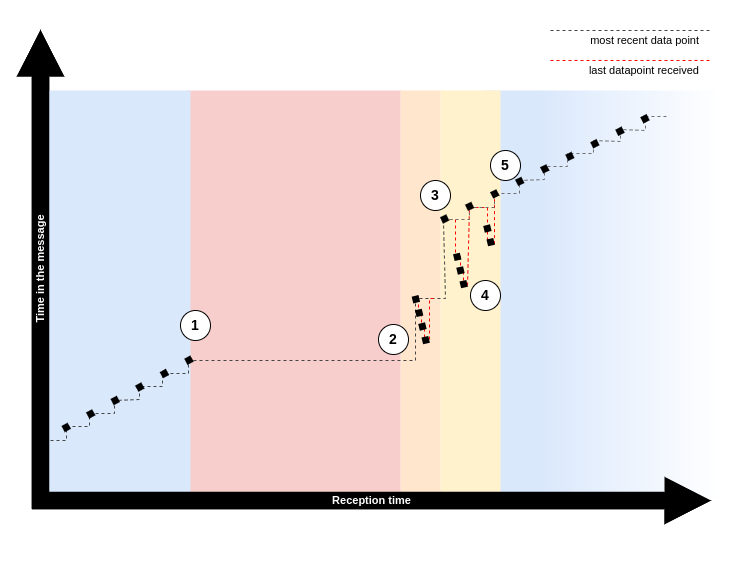
| Stage | What happens |
|---|---|
| Blue (left) | Device receives both GNSS and network signals. Data points are sent normally at 1Hz. |
| Red | Network interruption (1). Device stores data points in a buffer. |
| Orange | Network reconnects, but not GNSS yet. Buffered data is sent continuously (2). |
| Yellow | GNSS signal is up again. Last position (3) is always prioritized over any remaining buffered data (4). |
| Blue (right) | All buffered data had been sent (5). Behavior is back to normal with 1Hz updates. |
This example shows a special case where both network and GNSS signal are lost. More often, only network connection drops, so upon reconnection the last position will be sent directly as in the yellow area.
Handling out-of-order data points
Data points may arrive out-of-order, as illustrated by the red dashed line in the orange and yellow areas. Other network interruptions are also likely to occur again during these stages (not shown on the graph), which will further disrupt the chronological order.
A simple solution is keeping track of the latest timestamp received and discarding older messages, as shown by the grey dashed line. You can let the API server do it by setting the drop_older flag in the websocket settings, which we recommend doing when just doing visualization.
If you do require all data points to be processed, you can also enable the buffering feature. Data points will then be retained in an intermediate buffer and reordered before being sent on the websocket, which solves most ordering issues at the cost of some added latency. You can fine-tune this mechanism using the buffer_size and flush_timeout parameters.
GNSS signal losses
GNSS signal can be affected by obstacles such as trees, high buildings, or walls. It is not reliable inside or underground.
When GNSS signal quality is estimated to be too weak to be reliable, no data is sent over to the API.
The first implication for an API client using data from the websocket API is that when displayed as-is, the wearer will appear stationary during a GNSS interruption. We thus highly recommend implementing some mechanism to either extrapolate from previous positions or to detect that state and display relevant status information.
In case of a prolonged time without receiving data, you may assume that the device either went off (e.g. low battery) or remained in a place with no GNSS signal (frequently, wearers or team staff may leave or forget trackers in locker rooms).
GNSS data delay on cold start
When the device is turned on after a few days of inactivity (cold start) or if the location has changed since the last use (e.g. moving to another country), it will take longer for GNSS data to be synchronized on the server again, up to about 10 minutes in some conditions. This reason for this delay (called TTFF) is that the sensor needs to download detailed information about the position and trajectory of currently visible satellites. Usually it takes only a few seconds if the tracker was used recently (warm start).
Stand-still detection and filtering
Despite the high accuracy of Intense trackers, GNSS positioning data always include some amount of noise, which can be problematic when the device is still (e.g. left on a table). This is why a stand-still detection algorithm is embedded in the firmware.
The position data you will get on the API is raw, meaning there is no filtering based on the stand-still detection. Indeed, handling transitions to or from still mode correctly depends on the computation you want to perform. Typically, there can be a spike in speed when going out of still mode, which can disrupt some metrics for the rest of the practice session, such as metrics based on acceleration.
Therefore, it is important to handle the standstill flag appropriately when consuming data from the API, especially when performing computation sensitive to speed or distances.
On the older model AdmosLive, the behavior in stand-still mode is to repeat the last GNSS position and set the GNSS speed to 0. This behavior is an appropriate way to handle the still mode in most cases. However, be careful if your implementation is based on AdmosLive, because Intense will send raw data, which will cause many issues unless you handle the standstill flag.
A typical issue you may encounter is location jumping: a position that suddenly appears to teleport very far for a short period of time. This will completely disrupt aggregate statistics like total distance travelled that you might compute on your side.
Common issues
Look for these frequent problems:
- Low battery
- Battery may be drained due to GNSS or network tracking. This frequently happen when devices are left turned on in some enclosed space (e.g locker room).
- Absence or bad quality of network coverage
- Absence or bad quality of GNSS signal
- Outdated firmware (see how to update firmware)
- API integration issue
- What may look like a dysfunctional device can often be a client-side software issue
- Look out for inappropriate timeframe settings, start and end times, timezone conversions, misspellings...
- Use preprocessed ranges and related endpoints to check if any data was received on the API
- Inappropriate handling of the device
In case of trouble using the device, or of an apparent hardware issue, create a support ticket for the "Sensor" category.
Takeaways
- Do not assume live data arrives in chronological order. Instead, keep track of the most recent data point or use the appropriate websocket settings.
- Do not assume updates arrive continuously at a constant interval. Instead, interpret the absence of update as a temporary loss of GNSS or network signal. A long break may also signify the device has turned off.
- Use the
standstillflag to properly handle the absence of motion in your visualizations and data processings. - When testing your integration, the most likely causes of dysfunction are related to how and where the device are used.